If this is your first visit, be sure to
check out the FAQ by clicking the
link above. You may have to register
before you can post: click the register link above to proceed. To start viewing messages,
select the forum that you want to visit from the selection below.
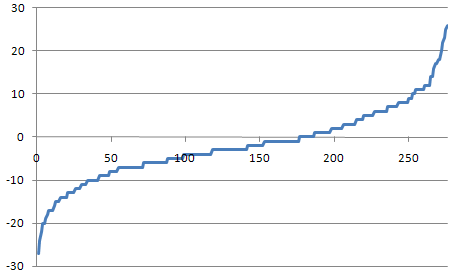
As a statistics teacher I should be able to interpret these.
AL has 100/275 players earning a profit.
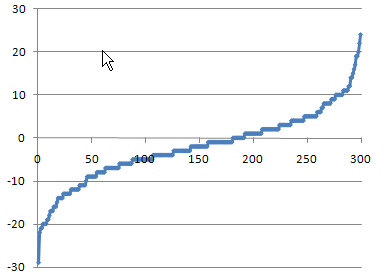
NL has 120/300 players earning a profit.
NL has greater maximum loss than AL.
AL has greater maximum profit than NL.
Any other conclusions?
Ottawa Triple Eh's | P.I.M.P.S. | 14 team keep forever
Champions 16,21 | Runner up 17,19-20
The FOS (retired) | MTARBL | 12 team AL 5x5
Champions 01,05,17 | Runner up 13-15,20
Enjoyed the article on BP, Jason. Good stuff. What do you think the implications are for auction strategy for 2012 and beyond? Does it support any particular approach (e.g. "spread the risk" vs. "stars and scrubs")?
I've done this 3 years in a row and there have always been more loss than profit in the mid year. I can't recall end of year, but I know that of the 3 years, even the year I came 2nd place in NL, I was still in the negative.
It's all about minimizing risks -- you have to assume about half your roster is going to lose value. You do what you can to control that value. In both leagues, 3 of the top 10 value gainers so far have been closers and at least 2 of the biggest 10 losers have been closer.
what software/engine are you using to generate the player values? also, is it the net difference between the current value and the preseason generated value, or the actual auction value?
One league, 28 years, 9 championships. AL 4X4
Current Lineup:
Ohoppe 2 Jeffers 5 JRamirez 39 Vaughn 16 WFranco 15 Semien 26 Lowe 5 Rengifo 6 R Lewis 10 Alvarez 39 Carpenter 10 P Lopez 6 G Rodriguez 5 Ragans 5 Holmes 10 JDuran 10
what software/engine are you using to generate the player values? also, is it the net difference between the current value and the preseason generated value, or the actual auction value?
 Tweet
Tweet
 - Wonderboy
Comment